Linking Maps and Data
Example Tools
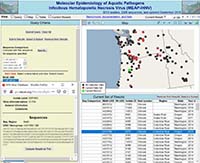
IHN Fish Virus Database
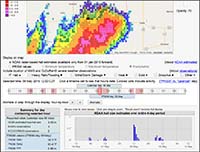 Severe Storms Tool
It is often time-consuming and error-prone to make sense of data coming from multiple sources. Using mapping techniques to link the data visually often leads to new discoveries and reveals where further research is needed. Consider, for example, a forest manager trying to determine where timber harvesting should be allowed. Harvesting new areas will require that logging roads be constructed, but they need to be located outside creek drainage or landslide-susceptible areas. To determine the best locations, the manager needs access to data from computational simulations, aerial photographs, rainfall and other climate sources, watershed buffer zones, etc. And the information must be integrated (it's too hard to converge and compare that kind of data in your head).
NACSE develops systems that integrate and interrelate distinct types of data and present them in flexible, easy-to-use mapping interfaces. That way, topography, rainfall, landslide susceptability, and other parameters can be compared on-the-fly, allowing resource managers to "play what-if", trying out the effects of different decisions.
Most of our mapping tools are components of decision-support portals that require appropriate authentication; some examples are shown at the right. Some publicly-accessible examples are:
- Transboundary Freshwater Dispute Database
- Long-Term Ecological Research H.J Andrews field site
- Dam Impacts on Rivers, Ecosystems and People